Support & Resistance in trading explained
Support and resistance are essential concepts for any trader aiming to read market behaviour with clarity. Recognising these levels helps improve entry and exit decisions.
Ever wondered why prices bounce back from certain levels or suddenly break through with force? It’s not random. These zones reflect the collective behavior of thousands of traders and institutions. These zones, also known as support and resistance levels, can give you a serious edge in the market.
In this article, we’ll break down support and resistance levels, explore why prices react at these points, and how smart traders use them effectively.
What is Support?
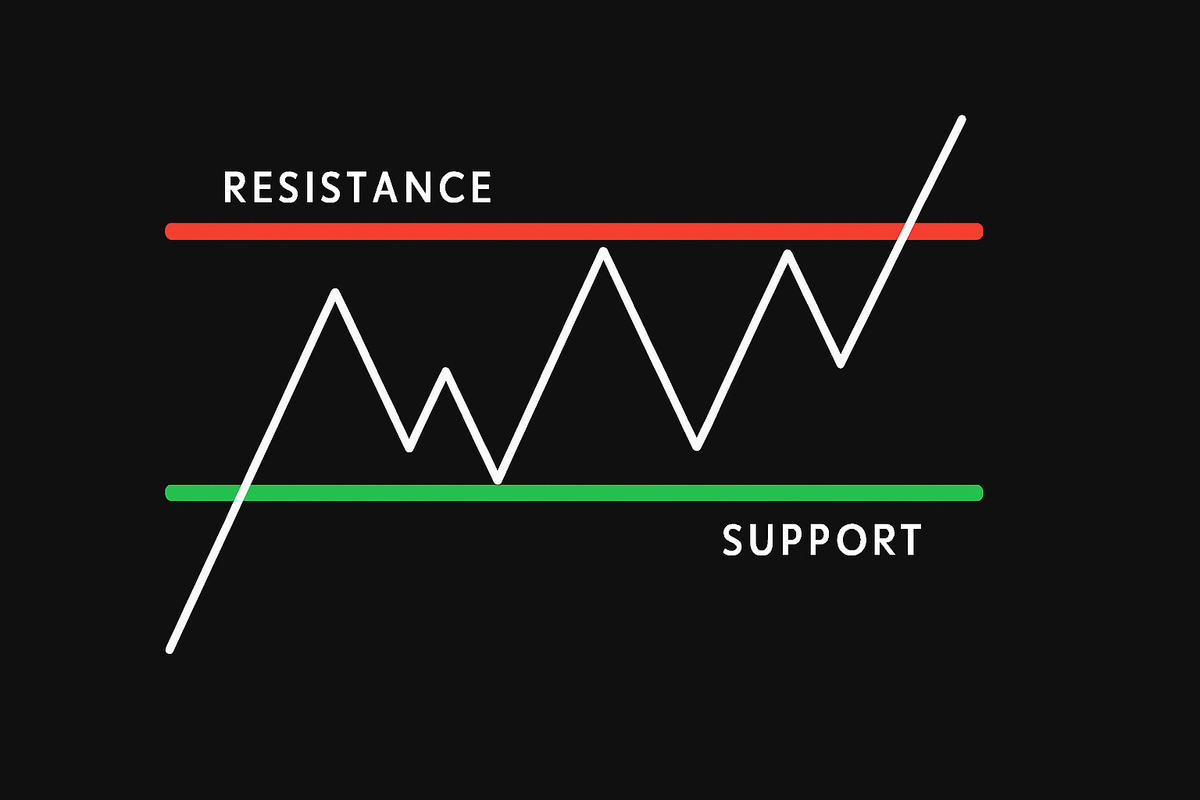
Support refers to a specific price level on a chart where a falling asset tends to pause or reverse direction due to increased buying interest. It often acts like a "floor" for the market.
When the price nears this zone, many traders expect it to hold, triggering buying activity that prevents further decline. This reaction is usually based on previous price behavior or strong psychological levels.
For instance, if a stock repeatedly falls to ₹500 and then bounces back, that ₹500 mark becomes a support level. Traders watching this level may place buy orders slightly above or at this price. If the level holds, it confirms the support. If it breaks, it might indicate a shift in trend.
Over time, consistently respected support zones help traders time better entries.
What is Resistance?
In trading, resistance refers to a price level where a stock tends to struggle moving higher. It acts like a “ceiling” where selling interest increases, often outweighing demand.
When prices approach this level, many traders anticipate a reversal and start selling, which adds pressure and prevents further upward movement.
Resistance forms due to past price behavior. For example, if a stock previously peaked at ₹1,200 and then dropped, traders may expect similar behavior when the stock returns to that level again. This creates hesitation, causing the price to stall or decline.
These zones are not exact numbers but rather ranges where supply typically builds up.
Identifying resistance helps traders time their exits, place stop-losses, or prepare for potential breakouts when prices finally move beyond that ceiling.
Why do prices react at these levels?
Support and resistance trading work because of market psychology and the collective memory of traders.
When prices reach a familiar level, participants often recall how the market behaved there in the past. This creates a natural tendency for buyers and sellers to place their orders around those zones.
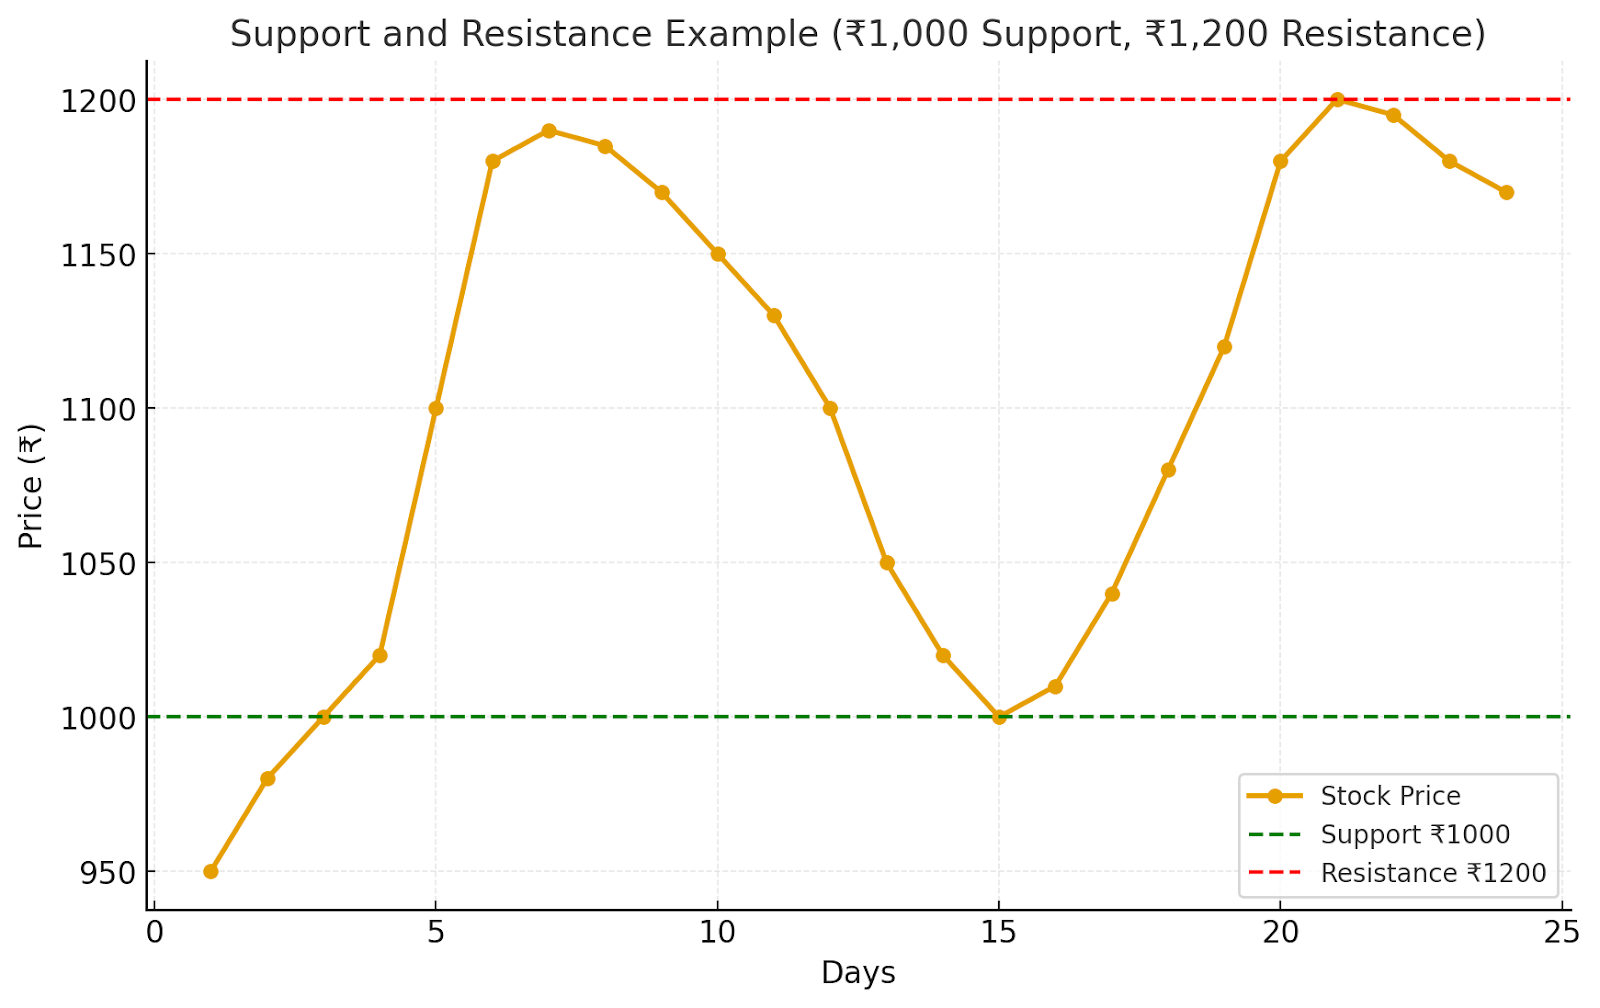
For instance, imagine a stock that has fallen to ₹1,000 multiple times but never gone lower. Each time it touches this level, buyers step in, believing it is a fair entry point. Over time, ₹1,000 becomes a strong support.
On the other hand, if the same stock repeatedly struggles to cross ₹1,200, traders recognize this ceiling as resistance.
Here’s a visual example showing how prices often bounce near the ₹1,000 support and struggle to break past the ₹1,200 resistance.
The reason prices react so consistently is that large institutions, funds, and even retail traders cluster their buy and sell orders around these levels. When demand outweighs supply near support, the price tends to bounce.
When supply is heavier near resistance, the price often pulls back. These reactions are not only technical but also psychological, since traders anticipate that others will behave in the same way.
How traders use Support & Resistance?
Support and resistance levels serve as reference points for making trading decisions. Traders rarely rely on them in isolation. Instead, they combine these levels with broader market context, chart patterns, and indicators to improve accuracy.
1. Entries near key levels
Traders often buy near support and sell near resistance because these zones reflect areas where price has reacted in the past.
Entering trades around these levels allows for tighter stop-loss placement and better reward potential.
This method does not assure success, but it provides a structured way that reflects how markets usually respond around known price zones.
2. Breakout and breakdown strategies
Another common approach is to trade when the price clearly moves through these levels.
A breakout above resistance may signal fresh buying momentum, while a breakdown below support can indicate stronger selling pressure.
These moves often attract high trading volumes, making them more reliable.
3. Placement of Stop-Loss and targets
Support and resistance levels help traders manage risk by guiding stop-loss and target placement.
A stop-loss is usually set just below support when buying or just above resistance when selling.
Profit targets are often placed near the next major level, allowing traders to lock in gains before price stalls or reverses near known zones of market interest.
4. Confirmation with other tools
Experienced traders do not depend only on support or resistance. They usually confirm these levels with volume, candlestick signals, or momentum indicators.
This practice helps them avoid false breakouts and poor entries. By combining technical levels with reliable evidence, they build confidence in decisions and lower the risk of reacting to random price behavior.
To wrap up
Support and resistance are essential concepts for any trader aiming to read market behavior with clarity. Recognizing these levels helps improve entry and exit decisions. With practice and proper analysis, traders can better anticipate price reactions, manage risk more effectively, and make more confident, well-informed trading decisions.