Option Chain Analysis: Key things to check
Option chain analysis helps traders decode market sentiment in Nifty and Bank Nifty by tracking strike prices, open interest, volume, and volatility. Learn the key factors to check for better trading decisions.
It is important to understand option chain analysis to make informed trading decisions when you trade indices such as Nifty and Bank Nifty in the Indian stock market. An option chain provides a comprehensive list of all available option contracts for a specific security. Let's discuss in detail.
What is an Option Chain?
An option chain includes all available option contracts (calls and puts) on an underlying asset (like Nifty, Bank Nifty, or individual stocks) for various strike prices and expiry dates.
For Indian investors, option chain analysis gives insights into what market participants expect: how much price movement they anticipate, what strike levels are “important”, where support or resistance might be, and how liquid different options are.
Key Checks in Option Chain Analysis
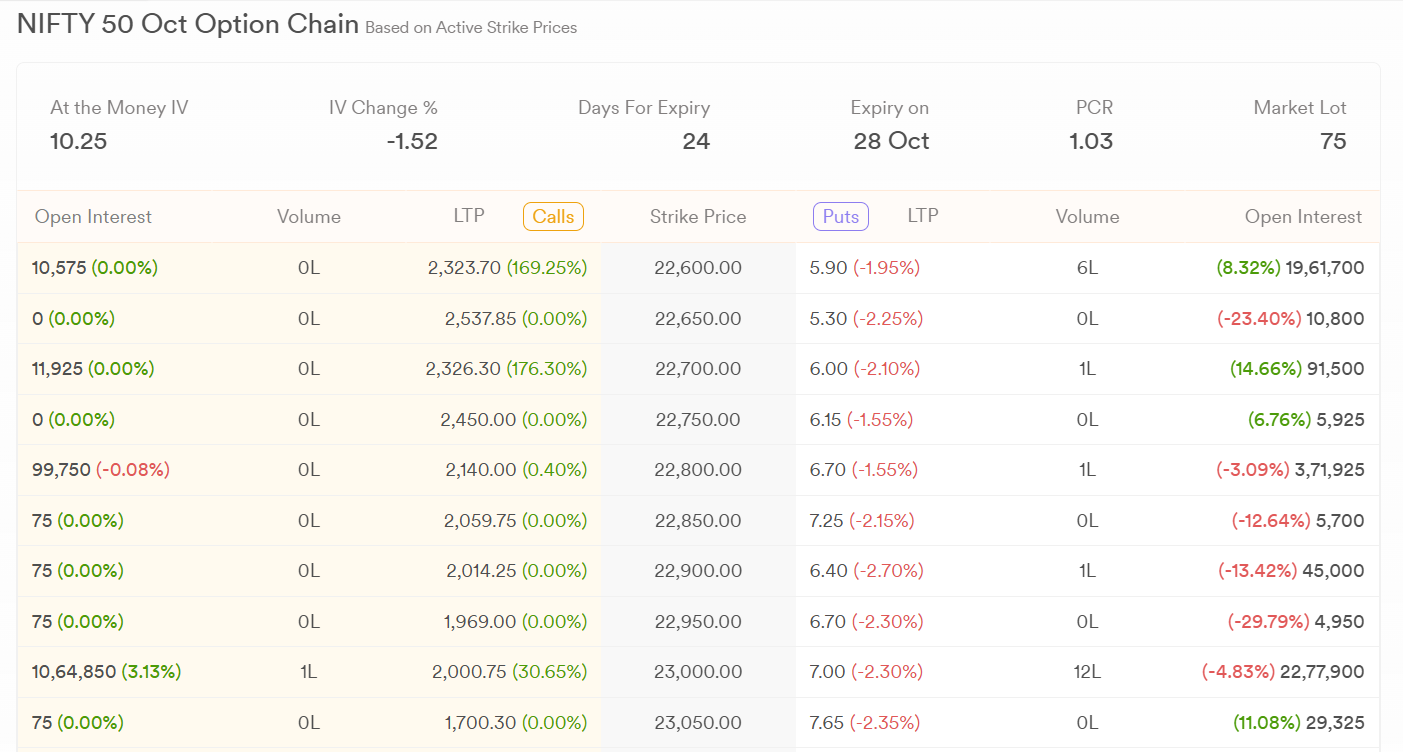
We will use this snapshot to understand each element.
Strike Price
The strike price is the pre-decided level at which you can transact the underlying asset.
If a strike has higher activity compared to others, it often indicates the market’s view on the price range of the stock or index. You should compare the strike with the current market price to understand whether an option is in-the-money, at-the-money, or out-of-the-money.
In the snapshot, with Nifty around 23,000, the 22,600 strike is out-of-the-money for Calls but shows strong Put activity with 19,61,700 open interest, highlighting a support zone near this level.
Open Interest
Open interest shows the total number of outstanding contracts that have not been settled. You can use this figure to identify the level of market participation and liquidity at a specific strike price.
If the open interest is high, it means more active trading, giving you a better chance to enter or exit positions without difficulty.
Always analyse open interest along with price movement to interpret whether positions are being built or unwound.
For instance, at the 23,000 strike, Calls have 10,64,850 OI (up 3.13%) while Puts have 22,77,900 OI (down 4.83%), suggesting a strong tug-of-war near 23,000, possibly the pivot level for expiry.
Volume Data
Volume shows the number of option contracts traded during the day. When you compare today’s volume with the average volume, it helps you identify sudden spikes in trading that signal fresh positions or the unwinding of old ones.
You should closely track volume at important strike prices because unusual surges may indicate strong momentum in either direction. In the Nifty snapshot, the 23,000 Put has 12 lakh volume, the highest among strikes, showing where traders are most active today.
Implied Volatility
Implied volatility shows the market expectations of future price movement in the underlying asset. When implied volatility is high, option premiums become expensive, which ultimately suggests that traders are expecting sharp swings.
On the other hand, low implied volatility shows a calmer market with cheaper options. In the snapshot, the At-the-Money IV stands at 10.25, which is slightly lower by 1.52%, suggesting the market is relatively calm despite being 24 days away from expiry.
Option Premium
The premium is what you pay to acquire an option or the amount you receive when selling one. It includes intrinsic value and time value, both of which are influenced by volatility and time left to expiry.
Try to track premiums across strikes. It lets you identify where contracts are overpriced or underpriced. In the snapshot, the 22,600 Call premium is ₹2,323.70, while the 22,600 Put premium is ₹5.90, showing that Calls have become expensive due to Nifty trading above this level and reflecting a bullish bias.
Put-Call Ratio
The put-call ratio compares the number of put options traded with the number of call options traded. Here is its formula:
Put-Call Ratio = Number of Puts Traded / Number of Calls Traded
A higher ratio suggests traders expect bearish movement as more puts are being bought, while a lower ratio indicates bullishness with greater interest in calls.
You should not read this ratio in isolation but analyse it alongside open interest and volume to confirm the trend. The overall PCR is 1.03, showing a balanced market sentiment, with slightly more Put interest, a sign of a mild bullish undertone as traders hedge downside risk.
Max Pain
Max pain is the strike price at which the most option buyers would face losses at expiry. It is calculated based on the cumulative open interest of puts and calls across strikes. Traders often use this concept to estimate the level where the underlying may gravitate towards near expiry.
Looking at the snapshot, the highest concentration of open interest is near the 23,000 strike on both Calls and Puts, suggesting this could be the current max pain level where Nifty might hover as expiry nears.
Break-Even
The break-even point is the level where the total premium paid or received is covered. For buyers, it is the strike price plus premium in the case of calls, or strike minus premium for puts.
For sellers, it represents the level where the collected premium is not eroded by market movement. For the 22,600 Call (₹2,323.70), the break-even point is 24,923.70, while for the 22,600 Put (₹5.90), it is 22,594.10, indicating a wide bullish bias range.
Option Greeks
Option Greeks like Delta, Gamma, Theta, Vega, and Rho measure different sensitivities in options. Delta shows how much the option price changes with underlying movement. Gamma reflects the rate of Delta’s change.
Theta measures time decay, while Vega checks sensitivity to volatility changes. Rho measures the interest rate impact.
Explore Dhan’s powerful Option Chain for real-time insights and smarter trading decisions.
To Summarize
Option chain analysis is a useful tool for Indian option traders when used with care. By checking open interest, change in open interest, volume, and liquidity, strike price alignment, implied volatility, and Greeks, you can develop a clearer picture of market expectations. Volatility tells us how “tense” the market is; expiry and news act as catalysts.
Using this data as part of your decision-making (not as the only factor) can help reduce risk and make trades more deliberate.