How to identify market trends using Price Action?
Spotting market trends doesn’t have to be guesswork. Price action reveals it all - if you know where to look.

Market trends are the underlying direction in which prices move over time. Whether an asset is rising, falling, or trading sideways, recognizing that trend early gives you an edge. Price action offers traders a clear view of market behavior by focusing only on price movements. Understanding how to read highs, lows, and candlestick structures helps identify trends early, making it easier to trade with confidence and discipline.
In this article, we will walk you through step-by-step techniques to identify market trends using price action.
What is Price Action?
Price action refers to the movement of a security’s price over time without relying on external indicators. Traders study these movements to understand how buyers and sellers interact in real time.
Instead of focusing on lagging signals, they read patterns such as higher highs, lower lows, and consolidation zones to anticipate market direction.
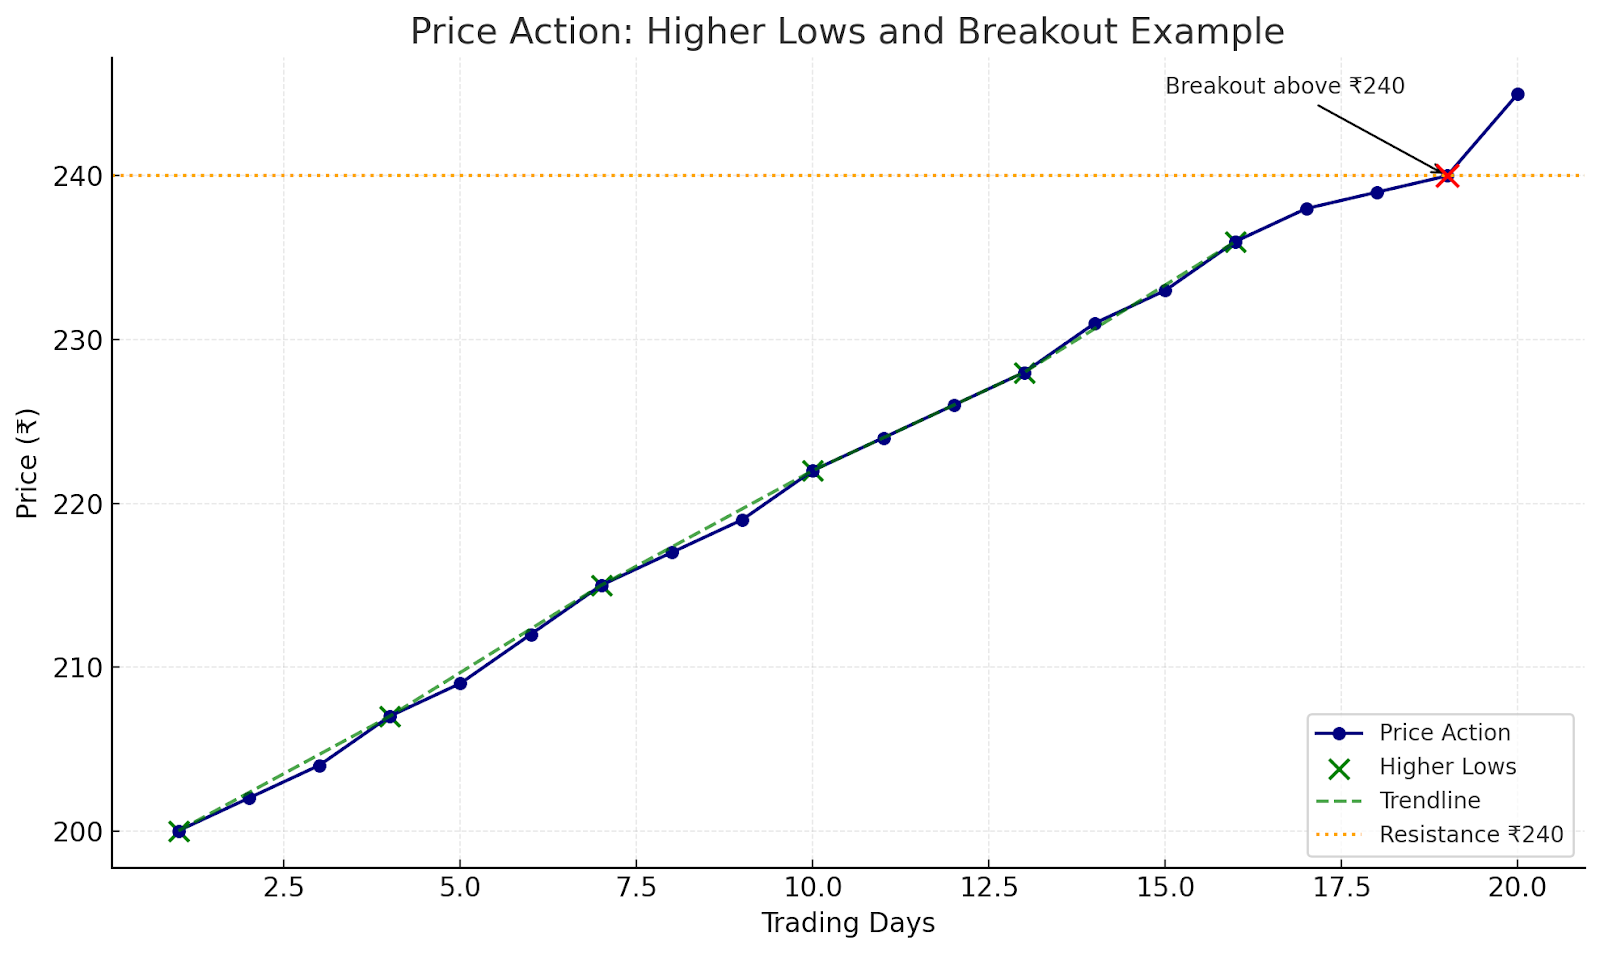
For example, imagine a stock that steadily moves from ₹200 to ₹240 over several sessions, forming a series of higher lows on the daily chart. This consistent buying pressure suggests an emerging uptrend.
A price action trader might draw a trendline under these lows and look for a clean breakout above ₹240 to confirm momentum.
To make this easier to grasp, take a look at the graph below that brings this example to life:
By observing raw price behavior in this way, traders gain direct insights into market psychology. Now that we understand what price action is, let's explore how to identify market trends using this approach.
How to identify market trends?
When you use price action to identify market trends, several tools or visual elements on charts become essential. Below are the key tools and how to use them effectively:
1. Zoom out to frame the bigger picture
When trading with price action, start with a higher timeframe, such as daily or weekly charts. These frames show the major trend direction more clearly and reduce the distractions caused by small price swings and random volatility.
A larger timeframe reveals support and resistance zones that are more meaningful and fewer false signals. It allows you to understand whether the market is trending up, down, or moving sideways before you focus on shorter timeframes for trade entries.
This method also helps align your strategy with the overall market bias, reducing risk from unexpected reversals.
2. Identify significant highs and lows, support and resistance
When analysing price action, one must locate swing highs and swing lows to define support and resistance zones.
For example, suppose a stock rises to 120, drops to 100, then climbs back to 125 before falling again to 105. The points at 120 and 125 become swing highs and define a resistance zone, while 100 and 105 act as swing lows, forming support.
These zones mark areas where supply has exceeded demand or vice versa.
Traders watch how the price reacts when it revisits these zones because failures or confirmations help signal trend continuation or reversal.
3. Check for trend structure
Trend structure is established by observing successive peaks (highs) and troughs (lows) in price movement. In an uptrend, buyers push prices so each new high is above the previous high and each new low is higher than the preceding low. That indicates strength and bullish momentum.
On the other hand, when sellers dominate price action, you will see lower highs and lower lows where each peak fails to reach the prior high and each valley drops below the past low, signalling a downtrend.
For example, if a stock rises to 50, pulls back to 45, then rallies to 55, pulls back to 48, that confirms higher highs and higher lows consistent with an uptrend.
4. Look for trendlines or channels
When you look for trendlines or channels, you are trying to draw boundary lines that the price respects over time, so that future moves become more predictable and clearer.
For example, imagine the price of stock XYZ forms three rising swing lows at points A, B, C, and two corresponding highs creating a roughly parallel upper line.
You draw a lower trendline connecting A-B-C, then draw a line parallel above touching the highs. Price keeps bouncing between these two lines. Each touch of the lower line gives you a chance to buy, each touch of the upper line gives you a chance to sell.
If price breaks above the upper line and retests it successfully, then the uptrend channel has been confirmed.
5. Watch for breakouts + retest or pattern confirmations
A breakout occurs when the price moves beyond a clearly defined support or resistance level, signaling potential continuation of a trend.
Traders should not rush in at the first sign of a breakout because false moves are frequent.
A more reliable approach is to wait for the market to retest the broken level. If the price respects this zone and begins moving in the breakout direction again, the setup gains validity.
For instance, when price pushes above resistance, pulls back to test it, and then resumes upward movement, the former ceiling often becomes a new floor, strengthening the case for trend continuation.
To wrap up
Recognizing market trends through price action helps traders interpret movements directly from the chart. Observing highs, lows, support, resistance, and candlestick formations provides structure and clarity.
When combined with patience, disciplined practice, and proper risk management, this method allows traders to make informed choices. Over time, consistent application strengthens confidence and improves overall trading performance.