Cup and Handle Pattern: Spot and trade breakouts
The cup and handle pattern in trading can reveal strong upside moves. Discover how to identify it, confirm signals, and trade with higher confidence.

Every trader looks for patterns that can simplify decision-making and improve timing in volatile markets. While indicators and news often drive entries and exits, chart patterns give a visual edge. They condense market psychology into shapes that are easier to spot and act upon, helping traders anticipate potential moves with more confidence.
Chart patterns help traders understand market behaviour, and one of the most popular is the cup and handle pattern. It often appears in both stock and forex markets and can signal a strong move upward after a period of price stability. Let’s look at the pattern and understand how to identify and handle it step-by-step.
What is a Cup and Handle pattern?
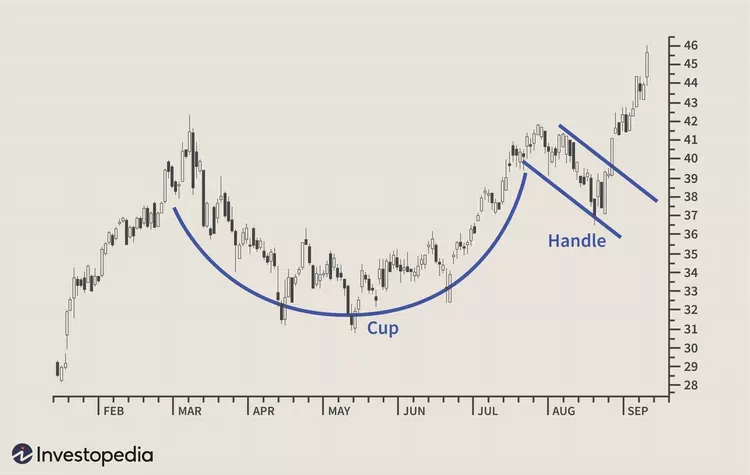
A cup and handle pattern is a bullish chart formation that resembles the shape of a teacup. It typically forms over several weeks or months and is considered a strong indicator of upward momentum. The pattern is divided into two parts:
The Cup
After a price decline, the cup forms a rounded bottom, like a “U” shape. This part suggests the market is stabilising, and buyers are slowly regaining control.
The Handle
The handle follows the cup and appears as a brief sideways or downward drift. It acts as a pause before the breakout.
How to identify?
Recognising the cup and handle pattern early can help traders enter positions just before a potential breakout. Below is a breakdown of the key elements to watch for:
The Cup and Handle breakout strategy
Timing the cup and handle pattern breakout is crucial. Entering too early can result in false signals, while entering too late may reduce potential profits. Follow this step-by-step strategy to trade the pattern effectively:
1. Identify Resistance: Draw a horizontal line at the top of the cup, marking the highest price before the decline, which serves as the breakout level.
2. Wait for Handle Completion: Allow the handle to form fully and stabilise. It should not fall below the bottom of the cup.
3. Confirm Breakout: Look for a decisive price move above resistance, accompanied by a noticeable increase in trading volume.
4. Set Entry Point: Enter the trade just above the breakout level once the breakout is confirmed.
5. Manage Risk: Place a stop-loss order below the handle’s low to protect against a failed breakout.
6. Set Profit Target: Measure the depth of the cup (peak to bottom) and add that value to the breakout level to estimate your price target.
Cup Pattern breakout vs other breakouts
Understanding how the cup pattern breakout compares with other chart patterns helps traders choose the right setup based on market conditions and goals.
Common mistakes
Even though the cup and handle pattern is considered reliable, traders often make errors that reduce effectiveness. Avoiding these common pitfalls can improve your chances of a successful breakout trade.
Wrapping up
The cup and handle pattern provides a good method of identifying breakout potential. There is less risk of trading, and you can trade more precisely by learning how to recognise the setup and waiting for the confirmation, such as an increase in volume and a clear breakout. Instead, what is important is to admit that not all the patterns go according to the scheme.